


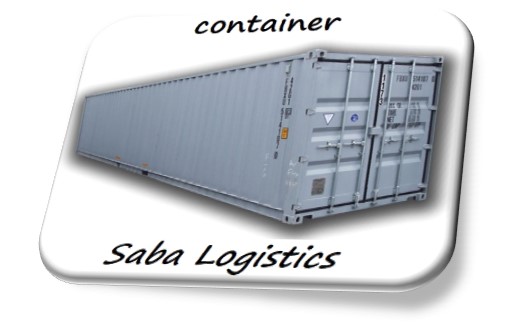
Container
Containerization is the technique or operation of placing cargoes in the containers of the same shape and size for transportation. Containers can be reused. Briefly, the process of transporting goods, occurs by placing them inside a container. Cargoes may sometimes be in unconventional and different shapes and sizes, but by placing them inside a container, they can be transported as a single unit, which provides many advantages for easier transportation, including cost and time reduction. Containerization also enables multimodal (combined) transportation, thus, it is possible to use a combination of various methods of transportation, from the origin to the destination, such as road, rail, sea and air transportation. Before containerization, the goods had to be loaded into the truck through repeated steps and then they had to be transported to the port, after that, they had to be unloaded from the carrier (truck) and loaded on the ship. It was an Overwhelming process that took a lot of time. To carry out unloading and loading operations, it was necessary for the ships to be in the port 10 days in advance. With the help of containerization, shippers began to stack their goods in containers and deliver them to the port’s container stacking area for shipment. The ships that arrived at the port could get charged or discharged within one to two days depending on the number of containers carried by them and then, they could continue the journey. According to the International Organization for Standardization (an international standard development organization composed of representatives from the national standards organizations of member countries that was founded on 23 February 1947) a cargo shipping container is: “one of the transportation equipment that is used to facilitate the transportation of goods by one or more transportation methods without intermediate loading.” There are many types and shapes regarding containers. ISO (the International Organization for Standardization) recommends containers with lengths of 10, 20, 30 and 40 feet, however, the most common types of containers are 20 and 40 feet. Nevertheless, it should be mentioned that now some shipping lines have started using 45-foot containers. The width of a container is always eight feet (2.43 meters) and the standard height is 6.8 feet (2.62 meters) and 6.9 feet (2.92 meters).
History of containerization
People assume that containerization is a new invention, but it is not. There is evidence of the use of containers in trams in England and USA around 1830. These containers, which were used to transport ore, limestone, coal, etc., were almost similar to the containers we use now, the only difference is that they are a little smaller and their maximum capacity range is 5 to 10 tons. The first appearance of the sea containers we see today, was in the second half of 1950. The reason behind the construction of these containers is a man who is called Malcolm MacLean who is known as the father of containerization as well. McLean (former truck driver in North Carolina) revolutionized the shipping industry by purchasing the Pan Atlantic Steamship Company in 1955. Years ago, while McLean was waiting for his turn at the dock, he observed goods being unloaded from trucks and transferred onto ships, in this way, the idea of using containers to transport goods grew in his mind. He was thinking about an alternative method that was easier and more cost-effective compared to this type of unloading and loading. After buying two other shipping companies, he did a series of research for using containers in his tanker ships. Finally, on April 26, 1956, a tanker named Ideal X sailed from the port of Newark, New Jersey to Houston. This ship was carrying 58 35-foot containers whose cargo was liquids. Following the success of the tanker, Ideal X, 6 cargo ships were converted to Trailer ships in 1957-58. One of the advantages that these converted ships had over the ideal X, was that these ships were equipped with cranes that could lift the containers from the dock, into the “cells”, which were smaller sections of the ship’s warehouses, However Ideal X was only able to use shore-based cranes. These converted ships were capable of carrying 226 35-foot containers.
History of TEU
The interesting fact about the word “Twenty-foot Equivalent Unit” is that it was created by a journalist called Richard FGibney who had been in journalism industry since 1960. He began his work by compiling tables and information on ordered and completed ships in England. In 1969, while he was collecting information on ships, he realized different sizes and dimensions of containers
which were used by different lines. Therefore, he used the term “Twenty Foot Equivalent Unit” as a standard for comparison. Regarding international trade the most common container sizes are 20,28,40and 48 foot but other sizes are available as well. For example, 10-foot containers are mainly used for military purposes. We got 24,44, 45-, 46-, 53- and 56-foot containers in exist. During a new process in Europe, 61.2 meters (8.5 feet) container use is widespread. The classification of these containers is under the ISO 02 standards. The reason why European shippers prefer these container dimensions is that this size allows two European standard palettes to be placed side by side.
This is a list of some of the major companies in the field of shipping and container transportation:
- Maersk SeaLand incl. Safmarine, commonly known as Maersk, with its headquarters in Copenhagen, Denmark, but with representatives in over 100 countries. The company has 387 ships.
- Mediterranean Shipping Company (MSC), with 257 ships.
- Samudra Group or Samudra Shipping Line, with 185 ships.
- P&O Nedlloyd, with 162 ships.
- Evergreen Marine Corporation, with 153 ships.
- Islamic Republic of Iran Shipping Lines (IRISL), which has 29 container ships. Of these, four are Mega size ships with a capacity of 14,500 TEUs, four have a capacity of 6,500 TEUs, four have a capacity of 5,100 TEUs, two have a capacity of 2,700 TEUs, four have a capacity of 2,500 TEUs, four have a capacity of 2,100 TEUs, and two are feeder ships with a capacity of 1,000 TEUs.
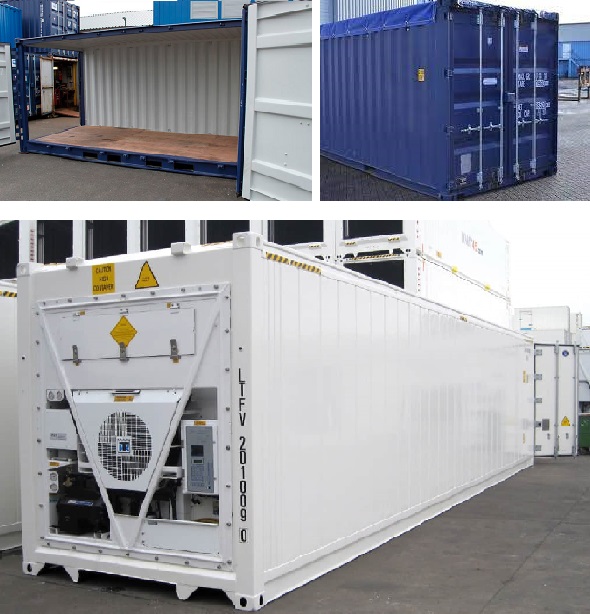
Types of Containers based on usage:
Various types of containers have been designed to suit different types of cargo, the most common of which are:
- General cargo containers
- Open top containers, which are usually covered with a tarpaulin and are used for carrying cargo with a height greater than the standard.
- Open side containers
- High-cube containers
- Open top and open side containers
- Refrigerated containers
- Insulated containers
- Heated containers
- Tank containers, which are made from a tanker that is fixed inside a standard container frame and is used for transporting liquids.
- Containers for transporting liquids
- Containers for transporting compressed gases
- Bulk cargo containers
- Platform containers
- Ventilated containers
- Super Rack Containers
- Flat Containers, which are open-sided containers
- Swap body, a type of standard container that is usually made very light so that they can be stacked on top of each other or lifted from above. Unlike most common containers in global shipping. These containers are made with less material or with lighter weight materials, which saves on initial purchasing costs and reduces fuel consumption in the long run. Swap bodies are often made with internal and external dimensions similar to standard containers used in shipping so that they can be loaded onto trucks, trailers, and railcars designed for shipping.
The most common type of container is the 20-foot and 40-foot container.
Standard dimensions and permissible weight for standard containers are defined according to the following table.
| Common containers | 20′ container | 40′ container | 40′ high-cube container | 45′ high-cube container | |||||
| imperial | metric | imperial | metric | imperial | metric | imperial | metric | ||
| Internal dimensions | longitude | 19′ 10 1⁄2″ | 6.058 m | 40′ 0″ | 12.192 m | 40′ 0″ | 12.192 m | 45′ 0″ | 13.716 m |
| width | 8′ 0″ | 2.438 m | 8′ 0″ | 2.438 m | 8′ 0″ | 2.438 m | 8′ 0″ | 2.438 m | |
| Height | 8′ 6″ | 2.591 m | 8′ 6″ | 2.591 m | 9′ 6″ | 2.896 m | 9′ 6″ | 2.896 m | |
| Internal dimensions | longitude | 18′ 8 13⁄16″ | 5.710 m | 39′ 5 45⁄64″ | 12.032 m | 39′ 4″ | 12.000 m | 44′ 4″ | 13.556 m |
| width | 7′ 8 19⁄32″ | 2.352 m | 7′ 8 19⁄32″ | 2.352 m | 7′ 7″ | 2.311 m | 7′ 8 19⁄32″ | 2.352 m | |
| Height | 7′ 9 57⁄64″ | 2.385 m | 7′ 9 57⁄64″ | 2.385 m | 8′ 9″ | 2.650 m | 8′ 9 15⁄16″ | 2.698 m | |
| door opening | width | 7′ 8 ⅛″ | 2.343 m | 7′ 8 ⅛″ | 2.343 m | 7′ 6″ | 2.280 m | 7′ 8 ⅛″ | 2.343 m |
| Height | 7′ 5 ¾″ | 2.280 m | 7′ 5 ¾″ | 2.280 m | 8′ 5″ | 2.560 m | 8′ 5 49⁄64″ | 2.585 m | |
| Internal volume | 1,169 ft³ | 33.1 m³ | 2,385 ft³ | 67.5 m³ | 2,660 ft³ | 75.3 m³ | 3,040 ft³ | 86.1 m³ | |
| Maximum gross weight | 66,139 lb | 30,400 kg | 66,139 lb | 30,400 kg | 68,008 lb | 30,848 kg | 66,139 lb | 30,400 kg | |
| empty weight | 4,850 lb | 2,200 kg | 8,380 lb | 3,800 kg | 8,598 lb | 3,900 kg | 10,580 lb | 4,800 kg | |
| Net loading weight | 61,289 lb | 28,200 kg | 57,759 lb | 26,600 kg | 58,598 lb | 26,580 kg | 55,559 lb | 25,600 kg | |

Shipping companies
First category:
This group includes large industrial owners and shippers who are active in industries such as oil, iron and metal, chemical industry, paper and forest products, automobile industry, food industry, etc. Their load is equal to the ship’s capacity and the need for transportation is regular and continuous. Therefore, this group owns the ships itself and even owns its own fleet for transportation. They also manage the ship through long-term lease. This transporting method is called Industrial shipping. It is estimated that about half of the tanker fleet is either owned or leased by oil companies. In the dry bulk market, about 30% of the available ship’s capacity belongs to large industrial companies. Assuming that this private fleet has the same productivity as the rest of the fleet, we conclude that about 1,600 to 2,000 million tons of cargo are transported by the industries themselves. It means that this amount of cargo is outside the free shipping market.
Second category:
Owners and senders of bulk goods are those who have a large volume of cargo but their need for transportation is irregular or even regular and continuous but does not justify private ownership of shipping. The owners of goods in this market are essentially small and medium-sized commercial and industrial groups and seasonal goods owners such as grains, fertilizers, coal, ore, and other bulk dry or liquid goods such as oil, minerals, etc. These types of goods are transported by tanker shipping. This market is large in size. All bulk liquid or dry goods, except those transported by industrial shipping, are in the tanker shipping market. In addition, a portion of miscellaneous (general) goods are also moved by tanker shipping. In fact, it is impossible to say exactly how many tons of cargo belong to this market (tanker shipping). But we can estimate that this amount of cargo constitutes approximately 45% of the total transported goods in the world.
Third category:
This group consists of owners and senders of goods and packages whose cargo is much smaller than the space in ship storages, whether their transportation needs are regular or irregular. These types of goods are transported by miscellaneous or general cargo shipping services. Senders of these goods must use liner shipping services – regular lines. Miscellaneous goods transported by liner services constitute 15-10% of the world’s total maritime trade and approximately 800-1000 million tons of cargo in recent years. Most of the ships used in liner shipping services are general cargo ships, Ro-Ro ships (Roll On-Roll Off), and container ships. In the maritime transportation industry, the shipping market is a competitive market because a large number of ship owners and cargo senders can freely enter or exit the market. The tanker shipping market – irregular lines – and liner shipping services – regular lines – are such markets, although the level of freedom in the real sense is different between these two markets. However, unlike these two shipping markets, industrial shipping does not make up such a competitive market. In this type of shipping, senders or cargo owners are the same as ship owners. Our discussion will focus on liner and tanker shipping services.
The status of container transportation in the world
The containerization of transportation has become two important global trends in the globalization of the economy and commercialization of transportation. The image below depicts the status of global trade in terms of current export value in trillions of dollars (blue line) and the volume of trade as a percentage of the world’s gross domestic product (green line) from 1960 to 2019. In 1977 (two years before the start of the Islamic Revolution), the value of global exports exceeded one trillion dollars, and in 2008 it reached the threshold of 16 trillion dollars. After the global economic crisis in 2018, this amount has reached about 20 trillion dollars. During this period, the proportion of global trade volume (total imports and exports) to the world’s gross domestic product has increased from about 30 percent in 1977 to over 52 percent in 2008. This upward trend has had a complete correlation with the increase in the volume of goods moved by global transportation (especially containerization). Of course, in each stage of the process, from raw material supply, processing, industrial manufacturing, assembly, and finally, ultimate consumption, it may be transported more than once.
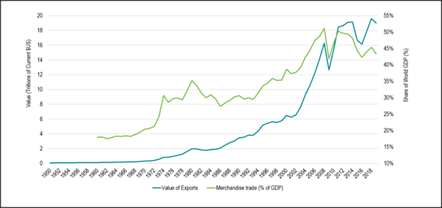
As shown in the above chart, the trend can be divided into three periods: the steady and gradual growth of global trade until 1980, the rapid growth period of 1980-2000, and the accelerated growth and reaching the initial peak in the period of 2000-2008. However, after the last period, an imbalance in foreign trade in favor of some countries (for their exports or imports) has emerged. China’s accession to the World Trade Organization at the end of 2001 had a significant impact on increasing global trade volume. In any case, over the past four decades, such significant growth in global trade and, consequently, transportation (mostly in the form of containerized transportation) has not been well reflected in Iran’s transportation system (especially rail transportation).
Trade imbalance, empty containers, and shipping tariffs
Trade between North America and East Asian countries (especially Japan, South Korea, and China) has been significantly imbalanced for a long time. In 1995, trade between these two regions was almost equal. However, in 2006 and then in 2018, the level of imbalance reached about 2.8 times. This level of inequality has had significant effects on the container system (in terms of the number of full and empty containers and related costs). Experts consider this trade imbalance and the reduction of some currencies’ parity against the US dollar as one of the reasons for the East Asian financial crisis in 1997. In the chart below, the light blue column represents the number of imports, and the dark blue column represents the number of exports (to/from) East Asia in millions of TEUs. The dashed line also indicates the import-to-export ratio of this group of countries. Due to the significant increase in trade volume in the 1990s and economies of scale, container shipping costs from Asia to America decreased by half. However, due to trade imbalances and the accumulation of empty containers in North America, this reduction in transportation costs and tariffs has benefited American and Canadian traders. It does not seem that such trade imbalances will disappear anytime soon, given the current economic structures of the world.
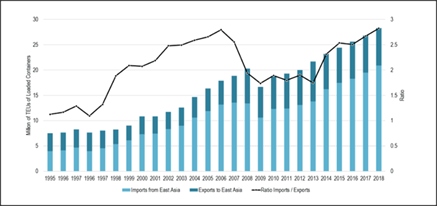
The status of container flow in different periods reflects the trade imbalances at the global level. The trade between East Asia and Europe also has significant imbalances. The return of empty containers imposes 15 to 20 percent of the operational costs on international shipping companies. In trade across the Pacific, the cost per TEU is generally higher towards the east (i.e., America) than towards the west (i.e., Asia). Therefore, cargo transportation planning for container shipping companies is complicated. This issue also applies to trade between East Asia and Europe. Thus, trade imbalances are manifested not only in the physical flow of containers but also in the level of shipping tariffs. Along with the increase in global trade and the improvement of container flow, the number of empty containers also increases regularly, leading to wider container yards and larger ships. The chart below reflects the growth of trade imbalances between East Asian countries and North American and European countries.
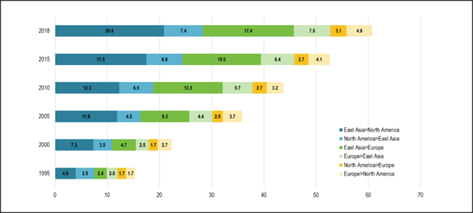
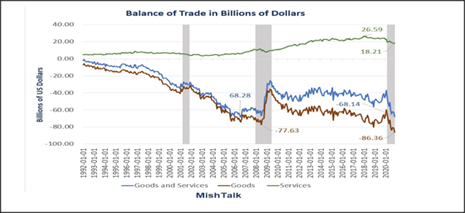
As observed in the above chart, from 1995 to 2018, East Asia’s exports to North America increased from 4 to 20.9 million TEUs (with an average annual growth of 7.13 percent), and exports to Europe increased from 2.4 to 17.4 million TEUs (with an average annual growth of 8.61 percent). Meanwhile, during the same period, East Asia’s imports from North America increased from 3.5 to 7.4 million TEUs (with an average annual growth of 3.17 percent), and imports from Europe increased from 2 to 7 million TEUs (with an average annual growth of 5.4 percent). These trade imbalances have resulted in continuous imbalances in the flow of full and empty containers between continents. According to the data from the US Bureau of Economic Analysis, the trade imbalance of the US during the period of 1992-2020 is well reflected in the image below. The brown, green, and blue lines represent the volume of trade balance in goods, services, and total (goods and services) in billions of dollars, respectively. While the trend of trade balance in goods is consistently declining, the trend of trade balance in services (especially new technologies) has been on the rise except for the last few years. Nevertheless, it seems that the total trade balance (goods and services) of the US is less influenced by the level of trade balance in services and has a high correlation with the level of trade balance in goods
Important points to consider in this regard
-The highest improvement in trade balance occurred during the severe economic recession of 2008-2009 (due to a significant decrease in imports).
– The worst period of trade imbalances in goods (at $86.36 billion) and total goods and services (at $68.14 billion) was recorded in November 2020. In this month, even the trade balance of services fell to the level of 2012.
– In the same month, the number of imports of consumer goods was $61.2 billion, and imports from China were $44.9 billion. This confirms the inefficiency of the trade war policy (based on increasing tariffs on imports) and the adoption of protectionist economic strategies in recent years.
The trend towards containerization of transportation
For more than half a century, transportation, logistics, and supply chain management have been moving towards containerization. At the beginning of this process, the important characteristics of containerization that have made it so popular are reviewed.
Characteristics of containerizing transportation
Although containers were originally created to facilitate transportation needs globally, after their standardization by the ISO organization, all means of transportation including airplanes, ships, trains, and trailers, as well as cargo handlers, warehouses, and loading and unloading equipment, have been adapted to the size and weight of containers, changing their shape and technology. On the other hand, with the emergence of containers in the world, vehicle manufacturers (especially ships) have tended towards larger and heavier vehicles. This trend has also led port managers around the world to initiate deeper docks and wider berths. These international efforts have not only increased speed and reduced energy consumption but have also significantly reduced transportation costs in the supply chain.
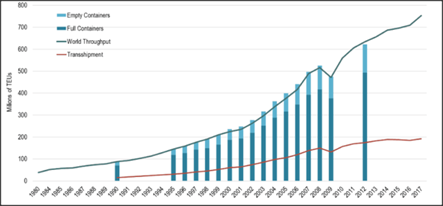
The chart below shows four factors: operational capacity (blue line), volume of goods shipped (brown line), and the number of full and empty containers (in the respective dark and light blue columns) in millions of TEUs from 1980 to 2017. As can be seen, except for the global trade crisis of 2009, operational capacity and the volume of goods shipped have been on a developmental path in all other years, and it is predicted that this trend will continue in future years, except for 2020.
Based on this outlook, significant investments are being made in increasing the capacity of container transportation vehicles (ships, trains, trailers, and airplanes), developing infrastructure capacity (ports, airports, and land routes) to accommodate these vehicles, and improving the related software systems.
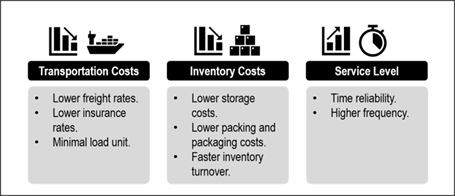
Containerization (as described in the image below) has benefits such as:
– Reducing transportation costs (due to lower tariffs on transportation, economies of scale, lower insurance rates due to reduced theft and damage to goods, and the acceptance of containers as a minimum unit for exports and imports to/from world markets).
– Reducing procurement costs (due to reduced warehousing, packaging, and inventory accounting costs, and faster asset turnover).
– Improving service levels (due to reliable scheduling and faster turnaround times for goods).
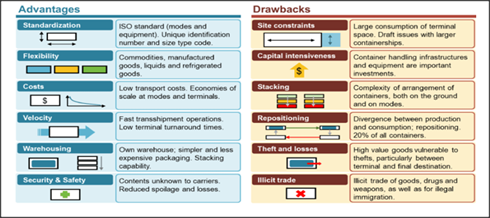
Containerization (as shown in the image below) has advantages such as:
– Standardization: Due to the ISO global standardization of container sizes, they can be used uniformly worldwide. The matching of infrastructure and transportation equipment specifications allows all transportation methods to easily move containers. In fact, the globalization of standards is the main advantage of containerization because it allows easy access to various distribution systems and minimizes investment risks in all transportation methods and terminals.
– Ease of use: With containers, a wide range of goods such as bulk materials (coal and grains), industrial products, perishable food items, frozen goods, and cars can be transported. Tanker containers can also be used for transporting liquids (petroleum and chemical products). In 2018, approximately 70% of these types of goods were transported using 2.9 million TEU refrigerated containers.
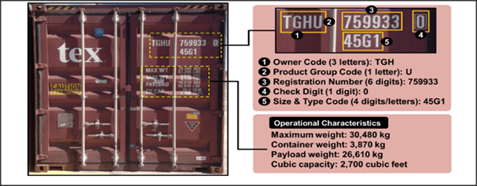
The container number and size provide the ability to manage transportation not based on the cargo but based on the container unit. At the entrance and exit gates of terminals, authorized representatives and cargo owners are identified automatically. Computerized management systems reduce the duration of stops and allow the location of containers to be determined at any time. Containers are then allocated based on destination priority and transport capacity. Transportation companies contact container handling personnel to store them on trains, airplanes, and ships. In this way, containers become the primary unit for the production, transportation, and distribution of goods. The image below shows the concepts of container numbering.
- Scale Economies in Container Shipping:Containerizing cargo shipment has in some cases reduced costs by as much as 20 times. Before containerization of shipping, the shipping cost for bulk commodities accounted for only between 5 to 10 percent of the retail price, which later reduced to 1.5 percent. The main factors behind this reduction were the possibility of faster and easier movement of goods through containers. Another factor was the ability of container ships to carry a high volume of containers which resulted in scale economies. The largest container ships in 1996 had a capacity of around 4,000 TEUs, around 12,000 TEUs in 2006, and close to 18,000 TEUs in 2013. A ship with a capacity of 5,000 TEUs has roughly half the operating costs of a ship with 2,500 TEUs. Thus, shipping with a 12,000 TEU ship is about 20 percent cheaper than a 4,000 TEU ship, providing economic benefits.High Speed: As containerization has increased speed of shipment, productivity of shipping has also increased proportionately. On the one hand, container ships have a cargo carrying capacity between 3 to 6 times that of conventional ships. On the other hand, speed of cargo movement has also increased. For example, a crane can on average perform 30 loading or unloading moves per hour. Thus, loading or unloading of goods that used to take 3 weeks in the 1960s now takes place within 24 hours. On the other hand, unloading 1,000 TEUs takes around 10 to 20 hours while for bulk commodities of similar size it takes around 70 to 100 hours.Storage and Safety: One important feature of containers is that they act as storage units themselves. They are resistant to impact and weather conditions and prevent damage to goods. For this reason, the packaging of containerized goods is simpler, smaller and cheaper. Insurance costs of shipping goods also become lower. Since containers are stacked on top of each other and have sufficient strength, containers can be stacked on trains, ships and warehouses on top of each other. The stacking height limit is up to 192 tons. Thus, with an average weight of 30 tons per container, up to 6 of them can be stacked on top of each other.
Challenges:
- Site Constraints: Containers occupy a relatively large space in terminals. For unloading ships with a capacity of 5,000 TEUs, at least an area of 12 hectares is required. Normal ports do not have so much space. Large container ships also require berths with a depth of 14 to 16 meters.
- Infrastructure, Equipment and Storage Costs: Containerization requires large gantry cranes (around $4-6 million), terminal equipment, port rail or road network. Storage stacking of containers needs to be planned based on unloading priorities to minimize movements.
- Empty Containers: Nearly half of a container’s life (10-15 years) is spent empty, i.e., without generating revenue, thus only incurring costs. Empty containers occupy space in vehicles and terminals. Due to the diversity of origins and destinations of cargo, there is typically an imbalance in the distribution of containers. Around 2.5 million empty TEUs are stored in terminals worldwide, which accounts for around 20 percent of shipping lines’ operating yield.
- Illegal Trade: Due to the confidentiality of container contents, counterfeit goods, drugs and weapons could also be shipped. Currently, only 2 to 5 percent of the world’s containers (especially in less developed countries) are inspected by human customs officials. The need for human presence, due to consuming a lot of time, requires a large space for containers waiting to be inspected. Most ports and border terminals today are equipped with electronic scanning (X-ray scanners), which are themselves capital intensive. In the picture below are the benefits:
Some of the challenges associated with the use of traditional methods have been eliminated as a result of the introduction of new technologies. In general, the benefits of containerization far outweigh its drawbacks, which is why container usage has experienced continuous and significant growth over the past few decades.